In a recent Tableau project, I wanted to divide a long span of years into decades, as this would provide a more visually effective way to grasp the growth of revenue from top movies (data from The Movie Database) over time. With a little searching, I found the pieces I needed. Below I’ll include a description of my process, followed by links to the helpful sources of insight I found on this topic.
First, here is the visualization with total revenues year by year. Notice that despite its current width you still have to scroll left to reach the early 1900s. Meanwhile, the difference year to year is not in itself that interesting.
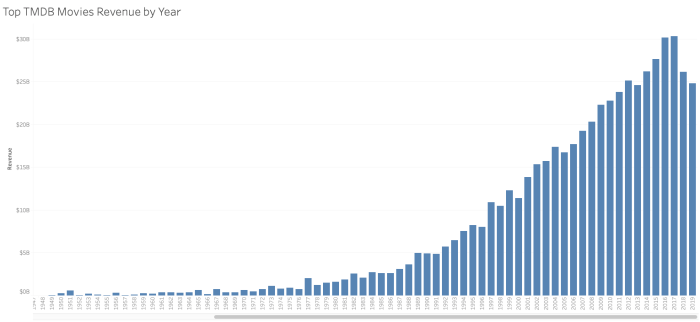
Now here is the visualization when years are chunked into decades. Much more effective!

DISCLAIMER: These charts use revenue numbers as entered in The Movie Database by contributors based on publicly reported figures. Thus, the data includes only a portion of all movies. I’ve as yet made no adjustments for inflation.
Getting to Decades from Dates
Now for the process of getting decades from dates. I broke my approach into two steps:
- I first created a calculated field to pull the Year from the Release Dates field, using Tableau’s DATEPART function.
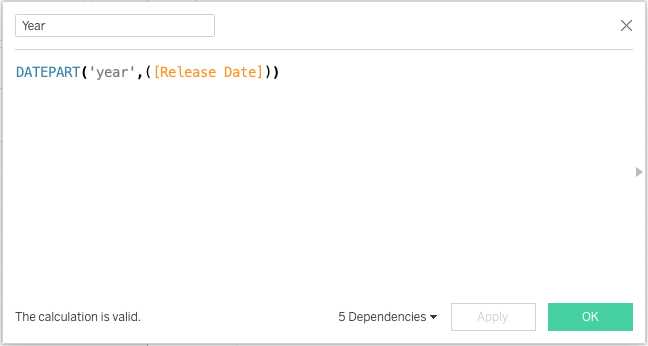
Once that field was created, I moved the new calculated field from Measures to Dimensions, where it should be.
- Then I created a Decades dimension as an additional calculated field. This calculation uses Year and the modulo operator to round each year down to the nearest multiple of 10.
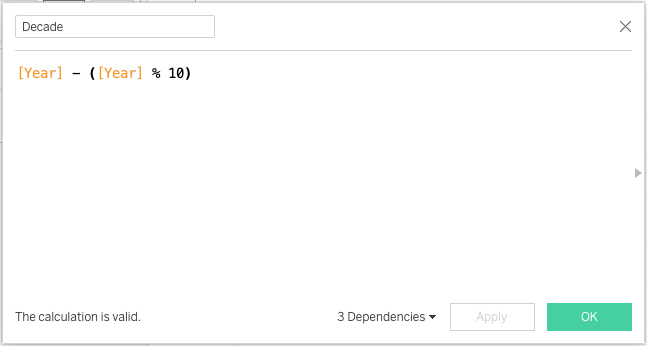
Then, similarly, once created, I made this calculated field a Dimension.
That’s all it took!
Many thanks to Nick Parsons and Erik Bokobza for their helpful replies in the Tableau Community Forums. Links below.
Recommended Reads
- Nick Parson’s response in the thread: Creating Decades from Years Using Calculated Fields – Tableau Community Forums
- Erik Bokobza’s response in the thread: Drill up to include multiple years of data – Tableau Community Forums
- Tableau Date Functions — specifically DATEPART and date__part values — in Tableau Help
