I’m excited about this penguins data set which has just been made publicly available. This will be much more fun for student projects than the old standard iris data set.
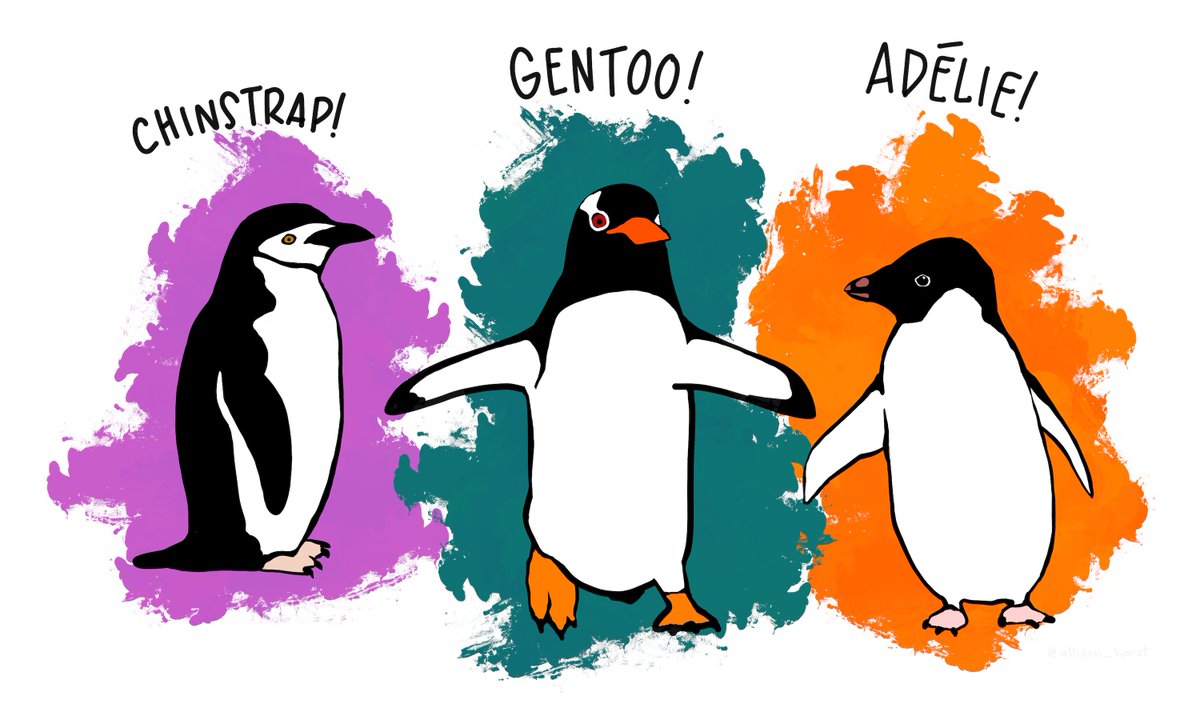
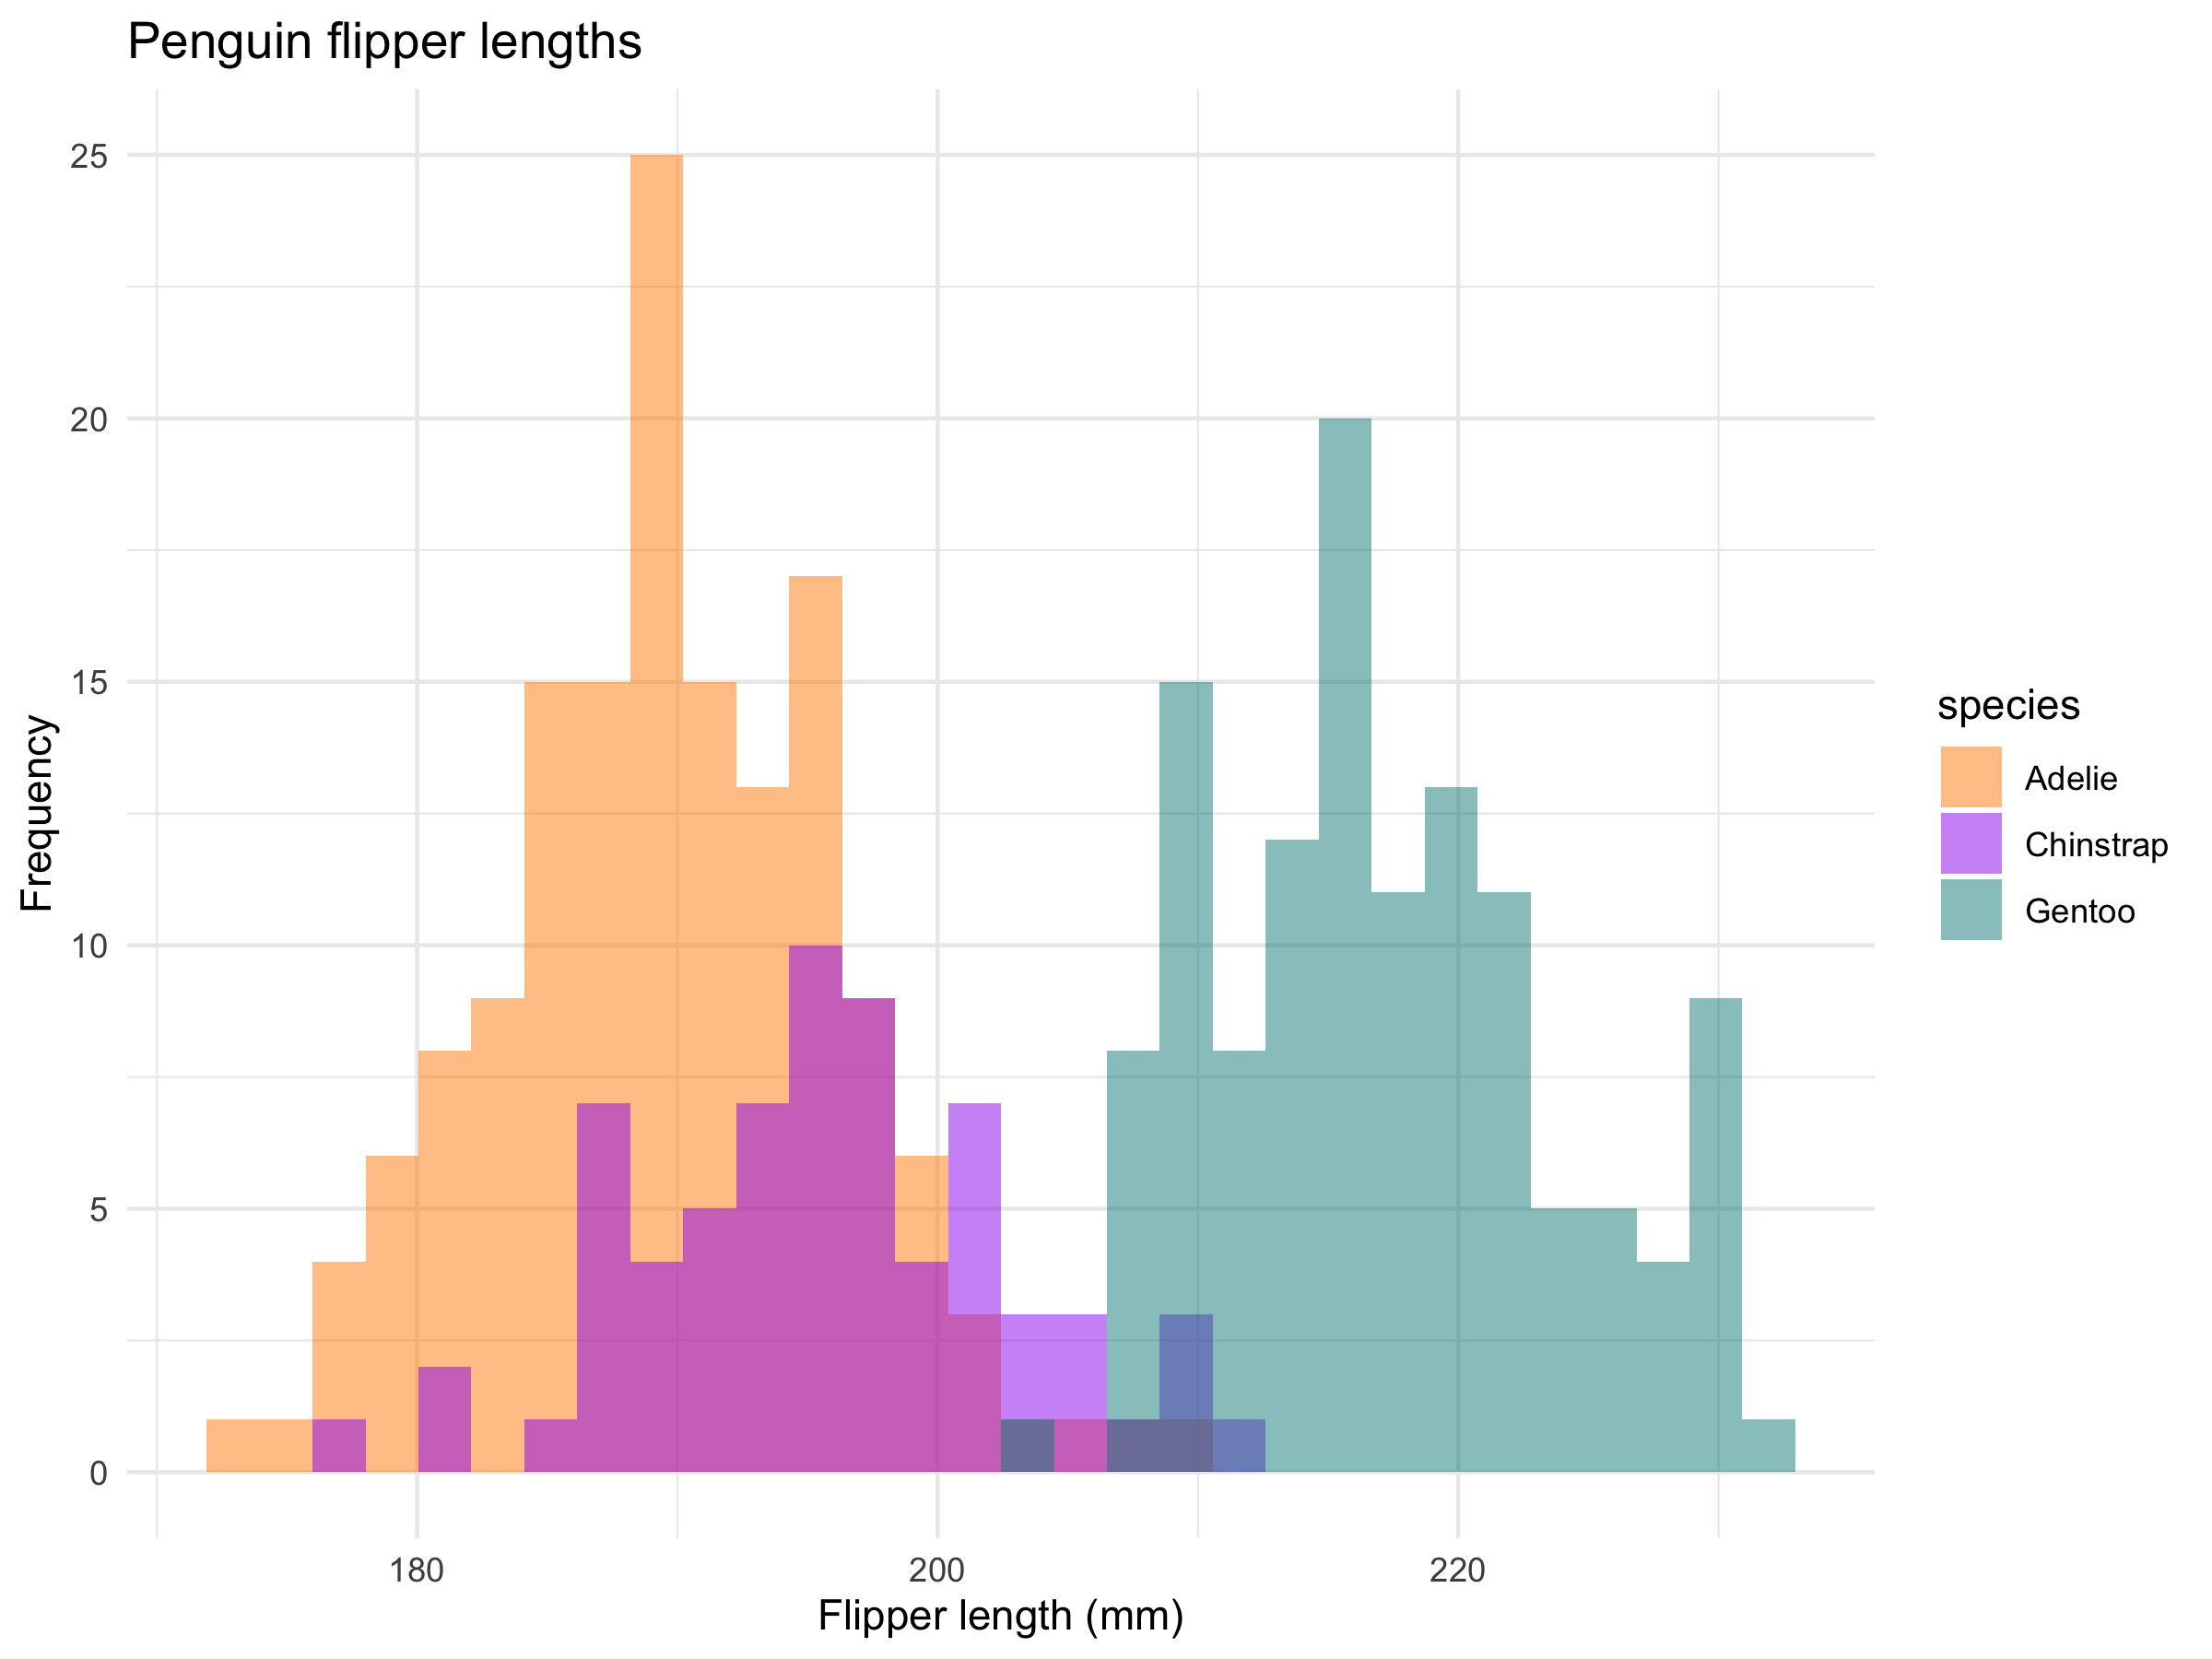
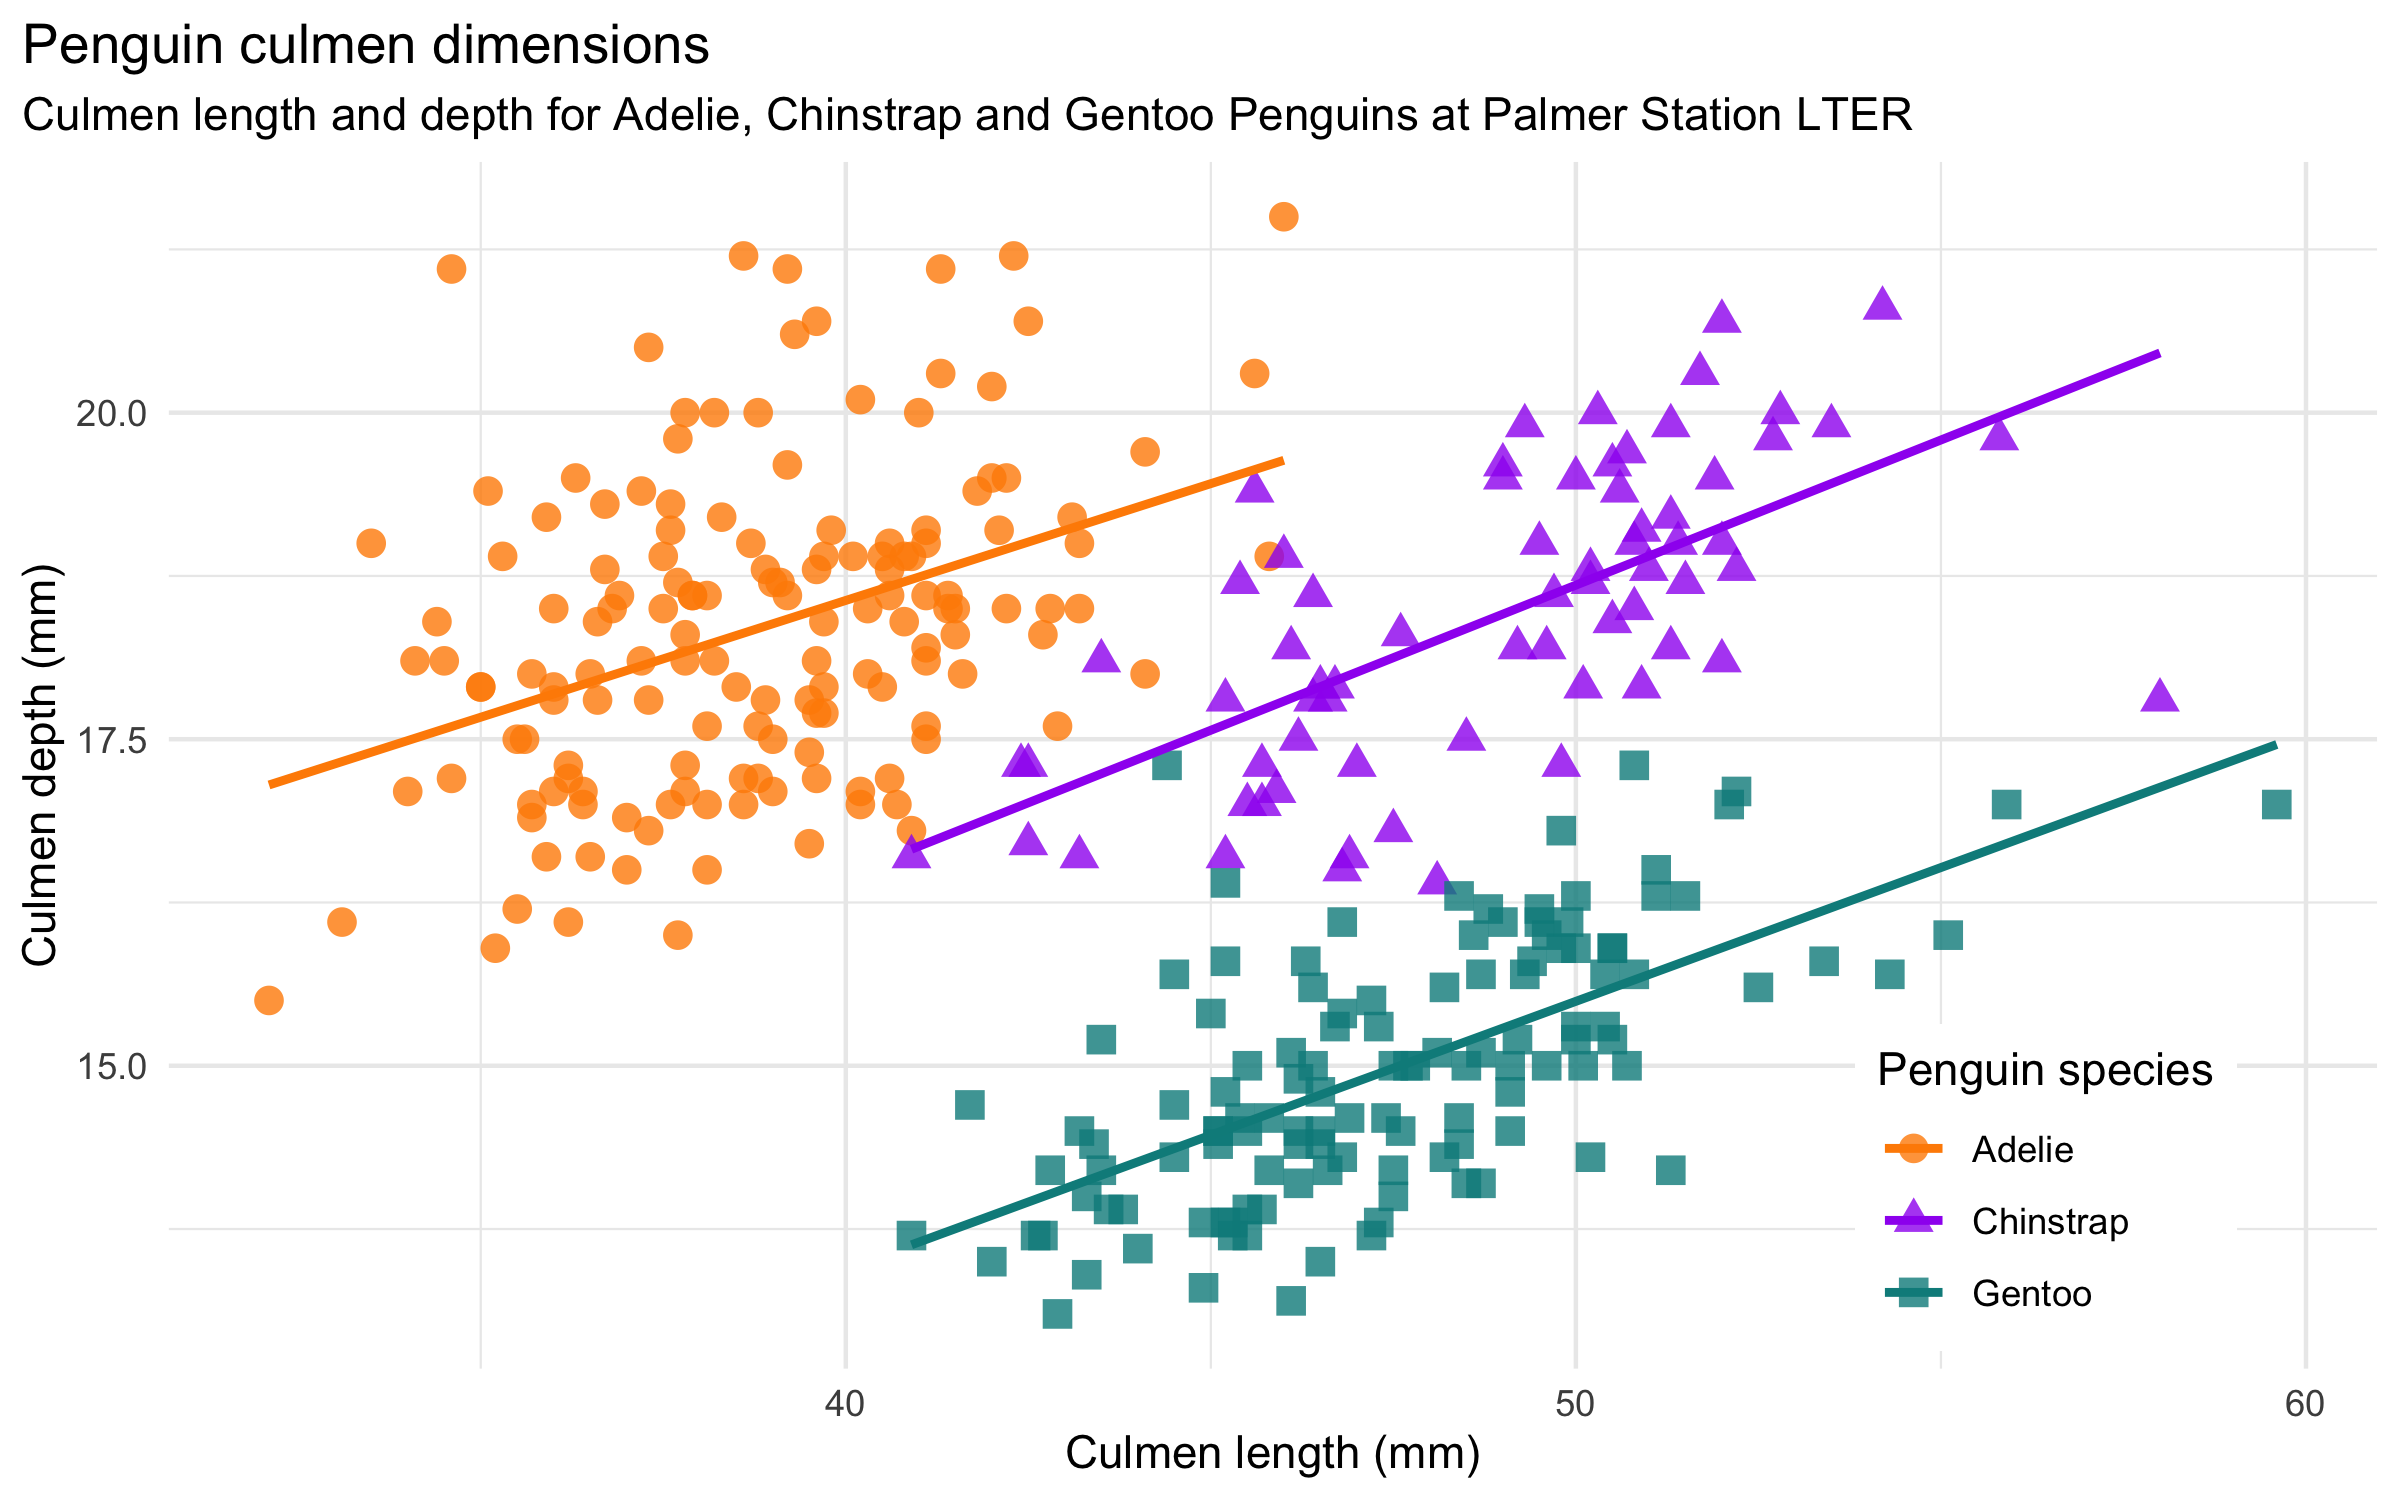
The data is from a published study on Antarctic penguins. It offers great opportunities for regression analysis, cluster analysis, etc. Here are two sample charts from the Github Readme:
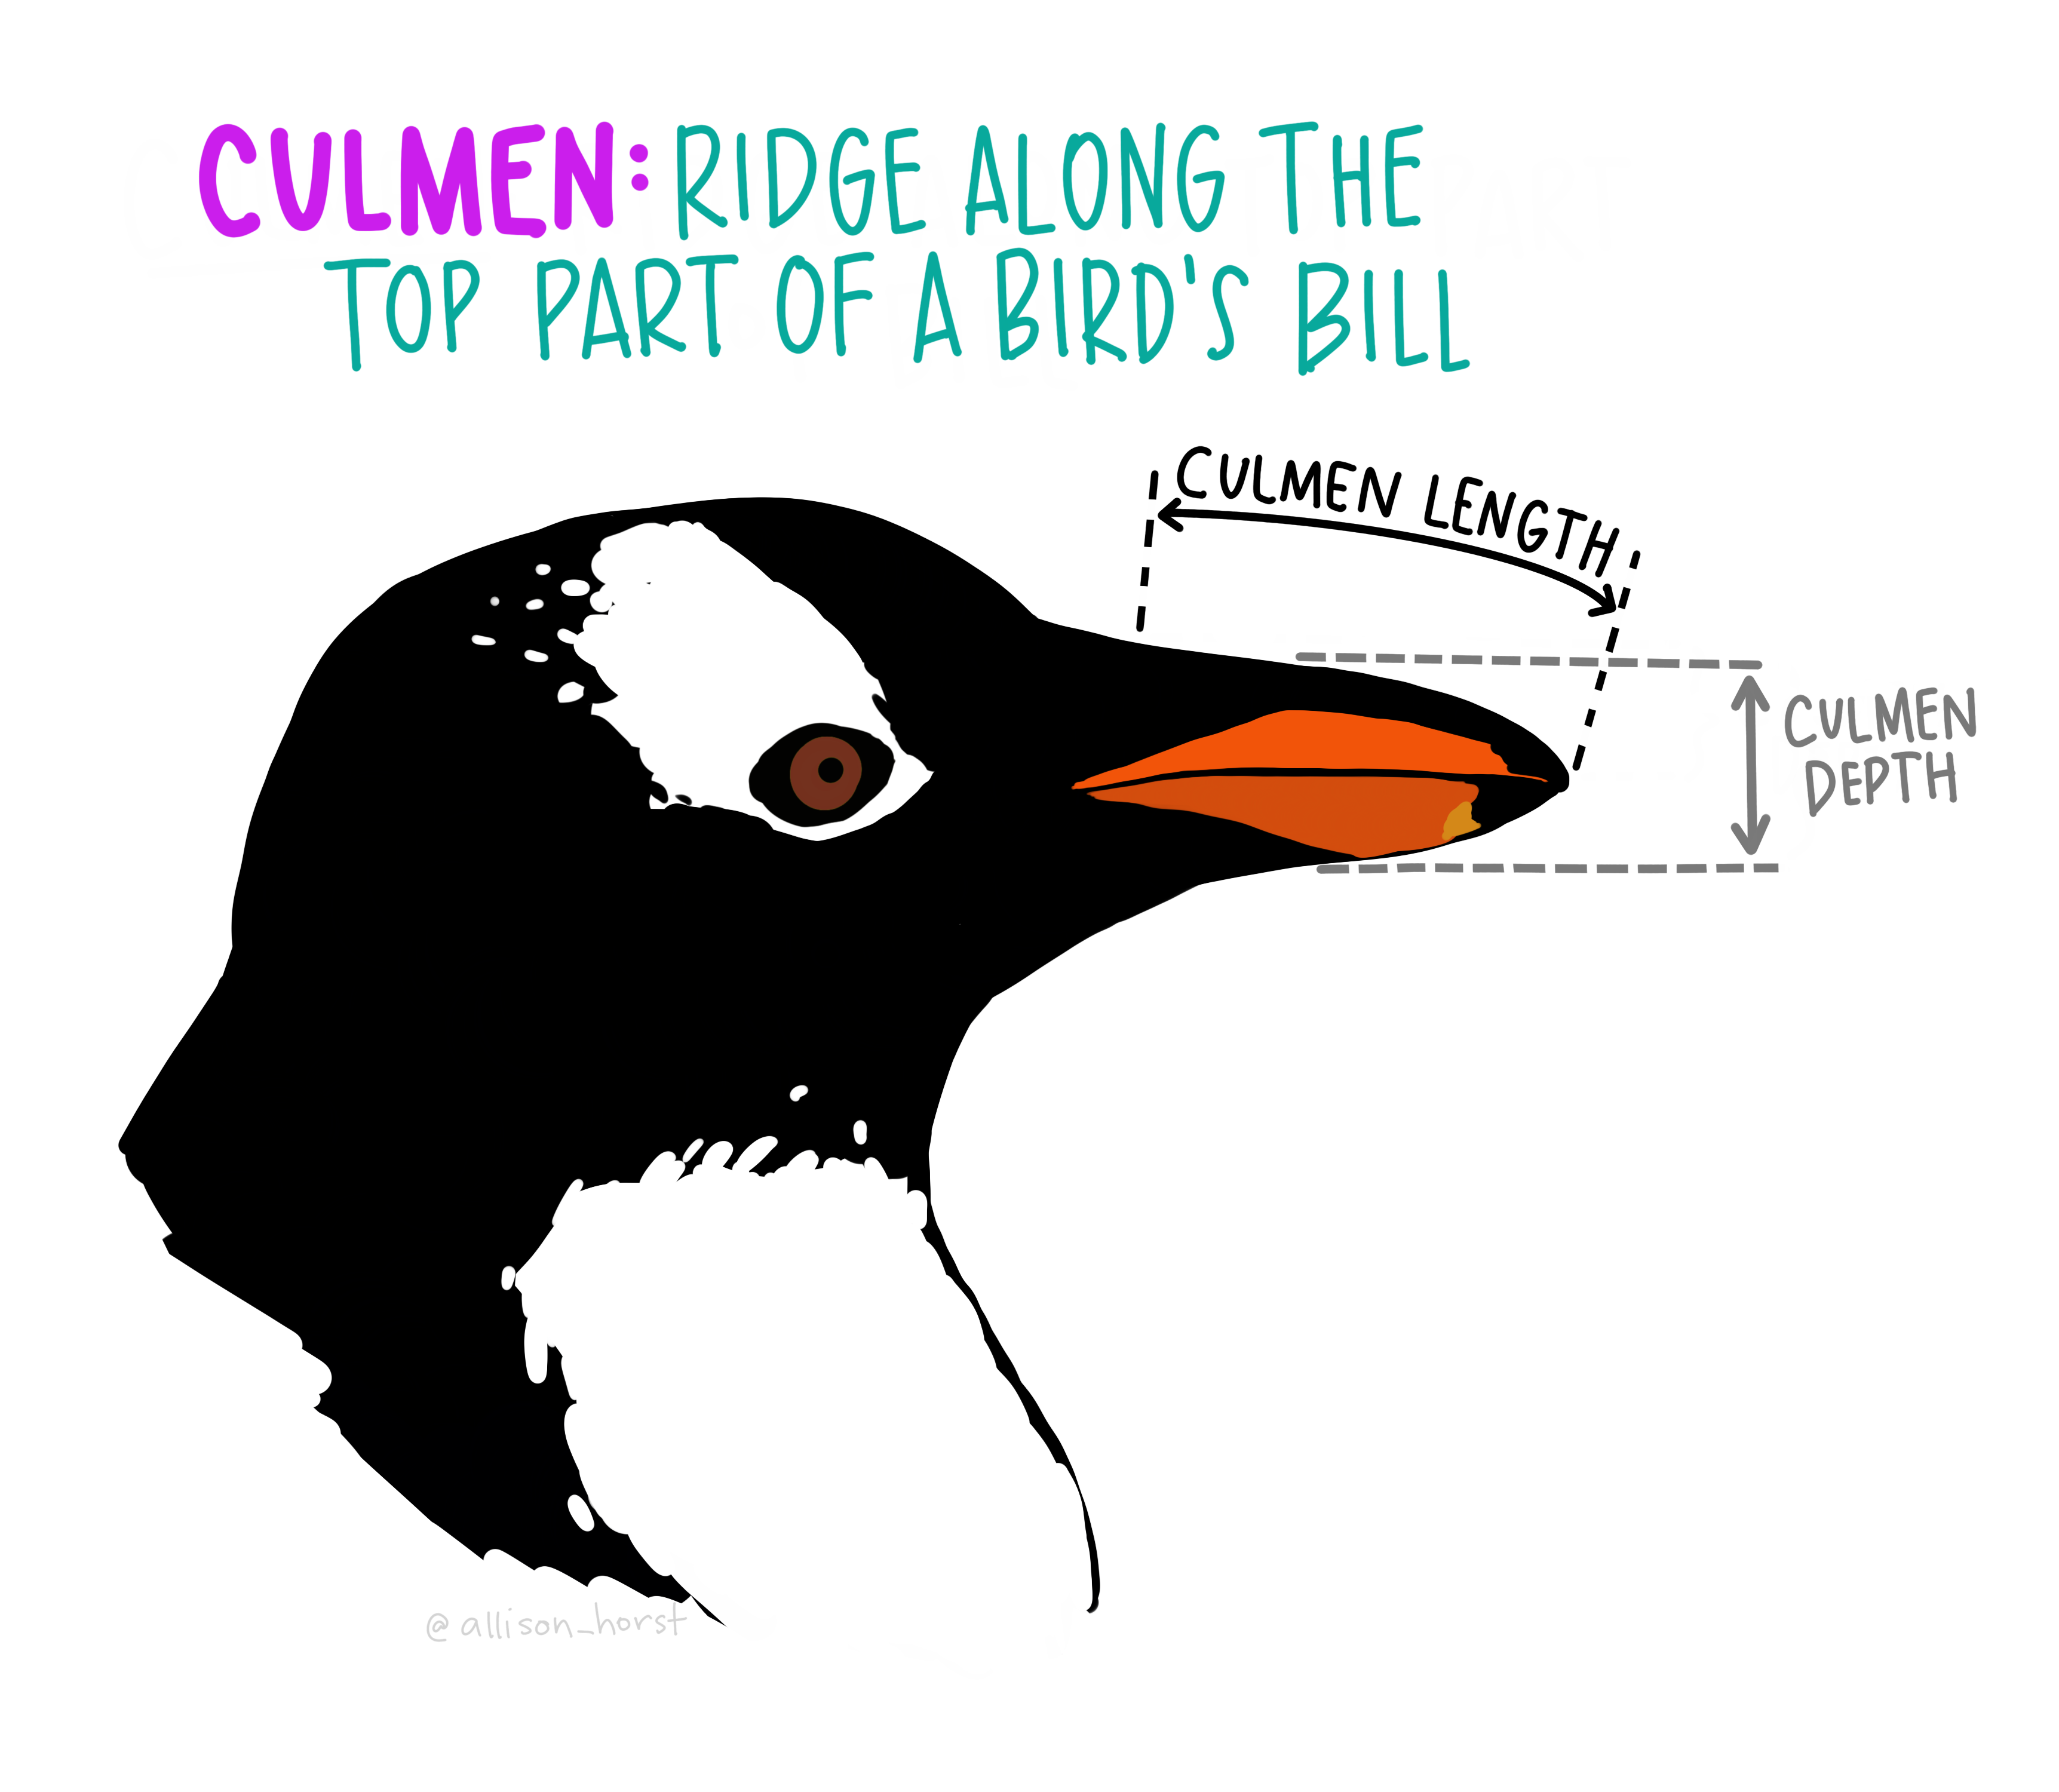
What’s a culmen you may ask? They’ve illustrated that nicely:
Links and Credits
The data set is available at Github here: https://github.com/allisonhorst/penguins
A CSV file of the full data set is available in the data-raw sub-directory. Here is a direct link. (You can view the raw version and then save it as a CSV file from your browser.)
Data were collected and made available by Dr. Kristen Gorman and the Palmer Station, Antarctica LTER, a member of the Long Term Ecological Research Network.
The data was used in the published study freely available here:
