If you’re an educator (or student) interested in leveraging Amazon Web Services through AWS Educate to host a cloud database that allows student connections — this post is for you. In what follows, I’ll document the process to:
- Configure and create a relational database instance from the AWS Management Console.
- Set a security profile that will allow students to read and write to the database remotely — such as from a database client, from a program they’ve written, from a Jupyter Notebook, etc.
- I’ll illustrate the process by creating a PostgreSQL database instance. Then I’ll provide illustrative code snippets for interacting with the database using Python.
The resulting database will be friendly for student projects that include database interactions such as querying, reading, and writing.
I’m going to assume that you’ve already created your Amazon Educate Account and are logged into your AWS Console. Thus, we’ll begin by creating a relational database.
Creating a Relational Database in the AWS Console
Once you have logged into your AWS Console, these are the steps to set up a relational database.
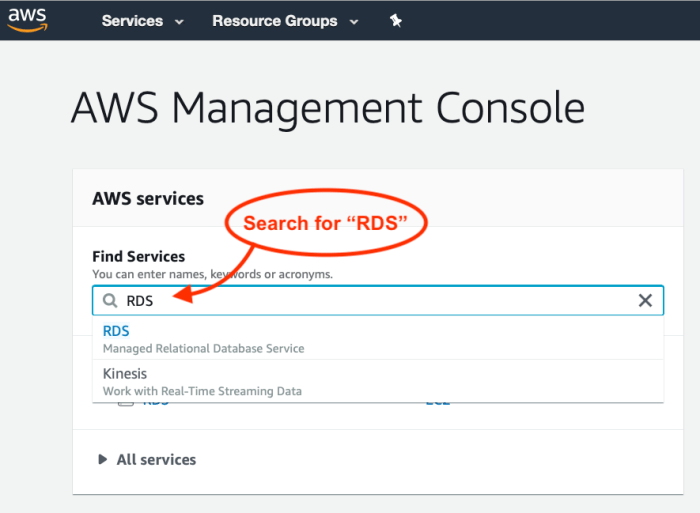
- Use the search field under “Find Services” to search for “RDS.” You should see RDS: Managed Relational Database Service appear in the results. Select and navigate to the RDS page.
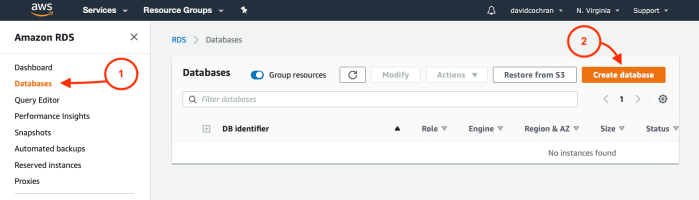
- Once you’ve arrived at the Amazon RDS page, select Databases in the left-hand sidebar, and then Create Database.
- From the Create Database page, select your desired options for creation method and configuration. You are free to choose differently, of course, but I have chosen these options:
- Standard Create — This will allow me to optimize the resources my database will use.
- PostgreSQL — A favored option among data science types. But choose what’s best for you!
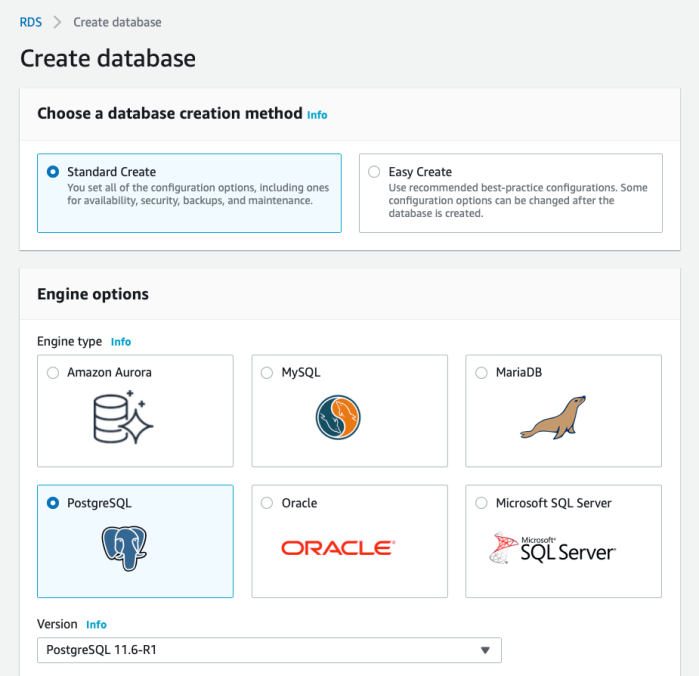
Choose your desired creation method and database engine.
- Select your desired Template (the labels here may depend on the engine you choose) according to your needed system resources and the size of your budget. I currently have access to the free tier, which I’ll use now. If that were not available, Dev/Test is the next least resource-intensive option I currently have.

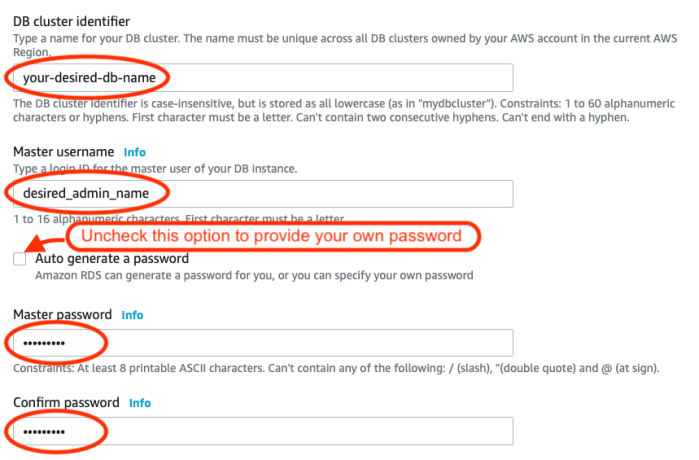
Choose the template according to your needed resources. - If you desire, edit the database name (identifier), master username, and password.
- Choose the DB instance size and storage (if relevant) that suits your needs and budget. I’ve chosen the least resource-intensive options, as these will be plenty for my intended use: basic CRUD operations performed by my students.

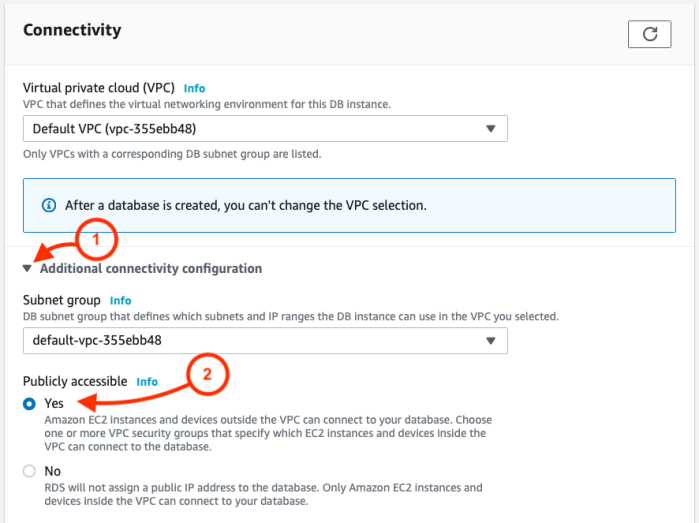
Choose instance size and storage according to the resources you need. - Under Connectivity, select “Additional connectivity configuration” and then “Yes” under Publicly accessible.
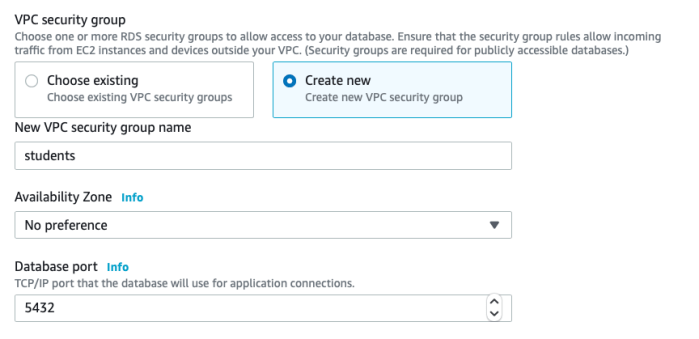
- You’ll be given the option to create a new security group. You can keep the default, or create a new group. I’ve created one named “students.” You’ll also see the database port settings.
- Depending on your selected database engine, you may (or may not) be given the option to choose Database authentication. With the PostgreSQL database I’ve chosen, I have these options, and I’ll choose Password authentication.

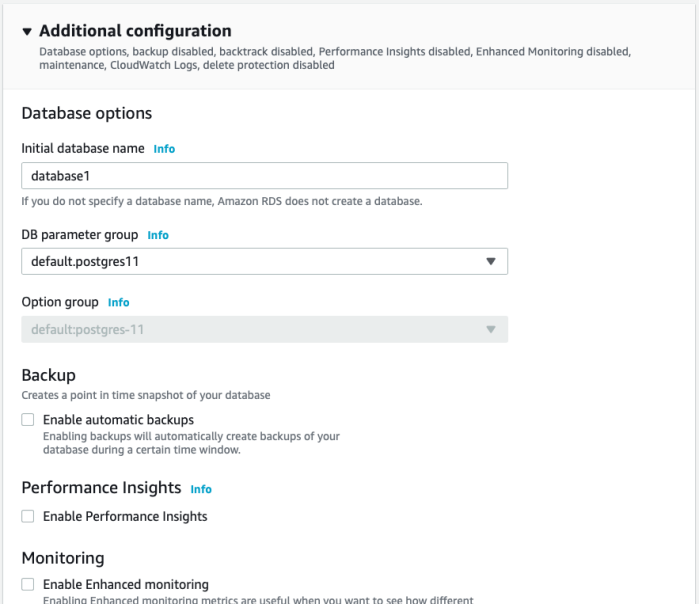
- Depending on your selected database engine, you may (or may not) be given Additional configuration options. If you’re unsure about these options, click the handy Info link to read more about them. I’ve deselected automatic backups in order to conserve resources.
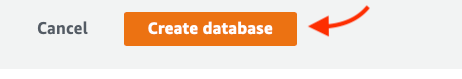
- If all looks good, click Create database!
- After clicking create, you may be given a message to go back and adjust a configuration option. If so, go back and do that. If all went well, you’ll be taken to a confirmation page. Here’s what mine looked like:
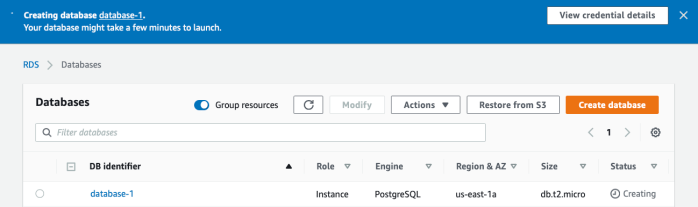
- Notice that you can click to View credential details — a handy way to get the login information and save it for future reference!
Congratulations! You’ve created your database!
Now we need to set a security rule to allow interactions with the database.
Allowing Inbound Traffic
In these next few steps, we’ll set a connection security rule to allow inbound traffic to interact with the database.
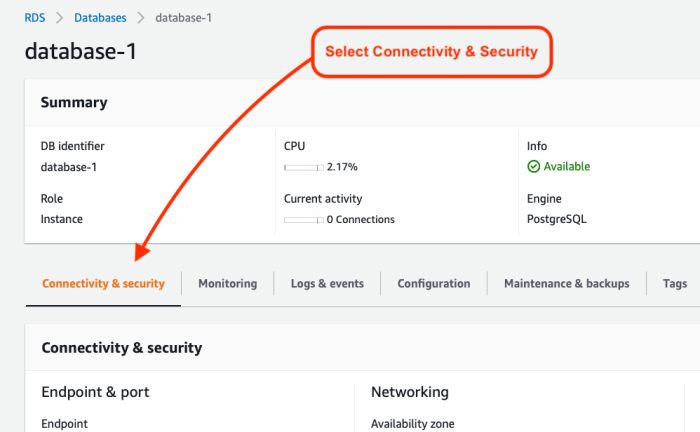
- Beginning at the RDS > Database page, click the database identifier.

- Select the Connectivity & security tab.
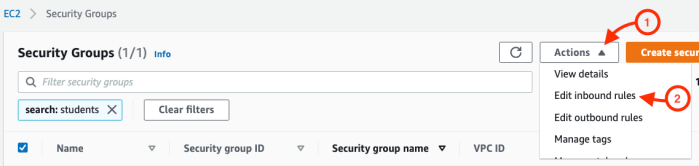
- Scroll down the page to Security group rules, and click to edit the Inbound rules.

- If necessary, select Actions, and Edit inbound rules.
- There should be an initial rule begun for you. Notice that the Type and Port range are already set to match your database settings. Now we need to allow a range of IP addresses. Configure this according to your needs. In my case, I’ll be working with online students. And since the database will not contain sensitive data, I’ll simply pull down the box under Source and select “Anywhere,” to allow traffic from any IP address.
 Once that’s been selected, I then see the result as two rules, allowing a full range of IP address options:
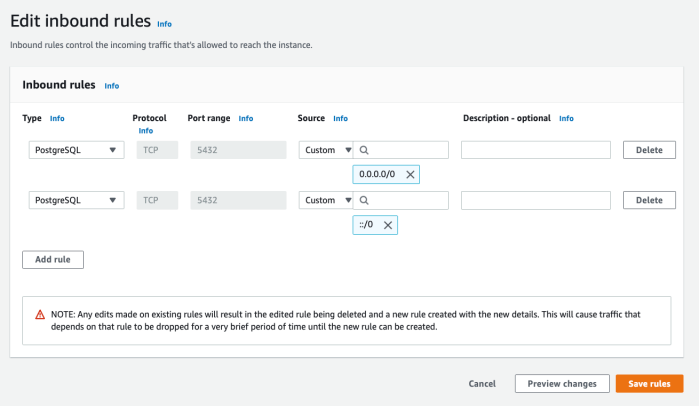
- Click Save rules!
Connecting to the Database
After creating the database, you can connect to the database using an application or database management package. You’ll simply need a few key items of information. These were supplied when you first created the database. The items include:
- Endpoint (aka host or hostname)
- Port
- DB name
- Master username
- Password
If you need to recover these later, you can do so by selecting the database from the RDS database list, and then looking under the two tabs: Connectivity & security, and Configuration.
The Endpoint (aka host or hostname) and Port can be found under the database Connectivity & Security details:

The DB name and Master username can be found under the Configuration tab:

As for the user password, you will hopefully have recorded or remembered it!
Those provide the essential credentials you’ll need to connect to the database.
In the next section, I’ll illustrate using these credentials to connect to the database, create a table, insert records, and query the table using Python.
Interacting with the Database Using Python
Python provides modules for connecting to any number of database engines. Since I selected a PostgreSQL engine, I’ll be using the psycopg2 module to interact with it. (For a MySQL database, you can use pymysql. And so on …)
If the module is not currently installed on your system, you’ll need to install it. In Python, this may be done easily using pip or conda:
- To install psycopg2 from the command line using pip:
-
pip install psycopg2 - To install psycopg2 from the command line using conda:
-
conda install -c anaconda psycopg2
Once the module is installed, you’ll simply import it to use it in your Python application or Jupyter notebook:
import psycopg2
Next we’ll establish the connection, using the psycopg2.connect() method, and providing the database information and login credentials, such as follows:
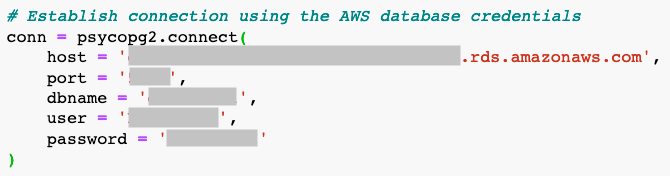
Then you can use lines such as follows to interact with it. (See the psycopg2 docs for guidance.)
# Start the cursor to enable SQL operations cur = conn.cursor()
# Create a table
cur.execute("CREATE TABLE test1 (id serial PRIMARY KEY, num integer, data varchar);")
# Insert a record
cur.execute("INSERT INTO test1 (num, data) VALUES (%s, %s)",
(101, "abcdefg"))
# Query the table
cur.execute("SELECT * FROM test1;")
# Output the query results cur.fetchall()
# Commit the changes conn.commit()
# Close the connection conn.close()
In Closing
That’s it! Your database is ready to roll.
AWS Educate provides a fantastic opportunity to equip students with cloud resources. In fact, it’s worth pointing out that both educators and students can follow these steps. If a professor should want students to create their own cloud databases for their projects, the above steps will serve them just as well.
I hope this resource proves helpful. Please comment with feedback, suggestions, and recommendations!